Sep 15, 2015
At Golang Uk I learned from Andrew Gerrand's talk that you can define a type inside a function.
I was curious if doing this would impact the performance of the code.
Later the same day I asked the guy that sat next to me that same question. Turns out that guy was Alan Donovan who is one of the authors of go oracle.
Alan told me:
Both codes compile to the same assembly code so it doesn't matter if you define it inside or outside the function.
Very interesting, I didn't know that :).
The next week I was watching bradfitz talk Profiling & Optimizing in Go and decided to use the methods he described to answer this same question on my own.
So this is what I did.
I want to answer this question:
Does defining a type inside or outside a function impact the performance of my code?
Note: I think it is interesting to understand how Go works under the hood. I was interested in using the methods described on Brad's talk to answer my own questions. I am aware that you wouldn't normally bother about the performance implication of this trivial case.
Start with a simple package:
Let's start with a very simple package typo defined in typo.go that has a function fn.fn defines a type, creates an object of that type then returns a string representation of this object.
package typo

import "fmt"

func fn() string {
	type T struct {
		id    int
		value string
	}
	t := T{0, "hello"}
}
Writing a benchmark test for your package:
In Go you can define normal tests if they start with the Test word or benchmark test if they start with Benchmark word. This is very useful to measure performance. In our case, we will compare the performance of the Benchmark test when the type is defined inside and outside the function fn.
This is how you would create a benchmark test in a typo_test.go file:
func BenchmarkFn(b *testing.B) {
	for i := 0; i < b.N; i++ {
		fn()
	}
}
If you run this benchmark test this is what you get:
$ go test -v -run=^$ -bench=.
PASS
BenchmarkFn-8	 2000000	       648 ns/op
ok  	local/typo	1.970s
This means the loop ran 2000000 times at 648 ns per loop.
Running the pprof profiler:
Another tool that you can use is pprof, to know more about it check this link.
You can run a cpu profiler or a memory profiler.
Let's run the benchmark test with the -cpuprofile flag:
$ go test -v -run=^$ -bench=. -benchtime=2s -cpuprofile=prof.cpu
PASS
BenchmarkFn-8	 5000000	       659 ns/op
ok  	local/typo	3.981s
The benchmark test generates a file typo.test and with the cpuprofile flag it creates the prof.cpu file. With these files you can now run the pprof tool to see where the time is spent when the benchmark test is run. Some useful commands are top, top --cum, list yourFunctionName.
$ go tool pprof typo.test prof.cpu
Entering interactive mode (type "help" for commands)
(pprof) top
3.80s of 3.85s total (98.70%)
Dropped 18 nodes (cum <= 0.02s)
Showing top 10 nodes out of 34 (cum >= 3.20s)
      flat  flat%   sum%        cum   cum%
     3.76s 97.66% 97.66%      3.76s 97.66%  runtime.mach_semaphore_wait
     0.03s  0.78% 98.44%      0.03s  0.78%  runtime.mCentral_Grow
     0.01s  0.26% 98.70%      0.03s  0.78%  fmt.(*pp).printReflectValue
         0     0% 98.70%      0.03s  0.78%  fmt.(*pp).doPrintf
         0     0% 98.70%      0.03s  0.78%  fmt.(*pp).printArg
         0     0% 98.70%      0.06s  1.56%  fmt.Sprintf
         0     0% 98.70%      0.06s  1.56%  local/typo.BenchmarkFn
         0     0% 98.70%      0.06s  1.56%  local/typo.fn
         0     0% 98.70%      0.67s 17.40%  runtime.findrunnable
         0     0% 98.70%      3.20s 83.12%  runtime.gcstopm
(pprof) top --cum
3.76s of 3.85s total (97.66%)
Dropped 18 nodes (cum <= 0.02s)
Showing top 10 nodes out of 34 (cum >= 3.20s)
      flat  flat%   sum%        cum   cum%
         0     0%     0%      3.79s 98.44%  runtime.schedule
         0     0%     0%      3.79s 98.44%  runtime.systemstack
         0     0%     0%      3.77s 97.92%  runtime.stopm
     3.76s 97.66% 97.66%      3.76s 97.66%  runtime.mach_semaphore_wait
         0     0% 97.66%      3.76s 97.66%  runtime.notesleep
         0     0% 97.66%      3.76s 97.66%  runtime.semasleep
         0     0% 97.66%      3.76s 97.66%  runtime.semasleep.func1
         0     0% 97.66%      3.76s 97.66%  runtime.semasleep1
         0     0% 97.66%      3.38s 87.79%  runtime.goschedImpl
         0     0% 97.66%      3.20s 83.12%  runtime.gcstopm
In pprof you can see the time spent in function fn by doing list fn
(pprof) list fn
Total: 3.85s
ROUTINE ======================== local/typo.fn in /Users/santiaago/Developer/go/src/local/typo/typo.go
         0       60ms (flat, cum)  1.56% of Total
         .          .      7:		id    int
         .          .      8:		value string
         .          .      9:	}
         .          .     10:
         .          .     11:	t := T{0, "hello"}
         .       60ms     12:	return fmt.Sprintf("%+v", t)
         .          .     13:}
In the same way, you can also run the memory profiler using the -memprofile flag:
$ go test -v -run=^$ -bench=. -benchtime=2s -memprofile=prof.mem
PASS
BenchmarkFn-8	 5000000	       660 ns/op
ok  	local/typo	3.991s
If you run pprof on the memory profile:
$ go tool pprof typo.test prof.mem
Entering interactive mode (type "help" for commands)
(pprof) top
512.19kB of 512.19kB total (  100%)
Dropped 11 nodes (cum <= 2.56kB)
      flat  flat%   sum%        cum   cum%
  512.19kB   100%   100%   512.19kB   100%  runtime.malg
         0     0%   100%   512.19kB   100%  runtime.mcommoninit
         0     0%   100%   512.19kB   100%  runtime.mpreinit
         0     0%   100%   512.19kB   100%  runtime.rt0_go
         0     0%   100%   512.19kB   100%  runtime.schedinit
(pprof) top --cum
512.19kB of 512.19kB total (  100%)
Dropped 11 nodes (cum <= 2.56kB)
      flat  flat%   sum%        cum   cum%
  512.19kB   100%   100%   512.19kB   100%  runtime.malg
         0     0%   100%   512.19kB   100%  runtime.mcommoninit
         0     0%   100%   512.19kB   100%  runtime.mpreinit
         0     0%   100%   512.19kB   100%  runtime.rt0_go
         0     0%   100%   512.19kB   100%  runtime.schedinit
You can also check the memory in fn by doing list fn.
(pprof) list fn
Total: 512.19kB
ROUTINE ======================== local/typo.fn in /Users/santiaago/Developer/go/src/local/typo/typo.go
         0          0 (flat, cum)     0% of Total
         .          .      7:		id    int
         .          .      8:		value string
         .          .      9:	}
         .          .     10:
         .          .     11:	t := T{0, "hello"}
         .          .     12:	return fmt.Sprintf("%+v", t)
         .          .     13:}
Recording your results:
Let's record our results:
$ go test -bench=. -memprofile=prof.mem | tee mem.0
PASS
BenchmarkFn-8	 2000000	       686 ns/op
ok  	local/typo	2.045s

$ go test -bench=. -cpuprofile=prof.cpu | tee cpu.0
PASS
BenchmarkFn-8	 2000000	       672 ns/op
ok  	local/typo	2.045s
We can now move the type definition outside of the function and see if something changes.
package typo

import "fmt"

type T struct {
	id    int
	value string
}

func fn() string {
	t := T{0, "hello"}
	return fmt.Sprintf("%+v", t)
}
And record these results as well:
$ go test -bench=. -memprofile=prof.mem | tee mem.1
PASS
BenchmarkFn-8	 2000000	       638 ns/op
ok  	local/typo	1.933s

$ go test -bench=. -cpuprofile=prof.cpu | tee cpu.1
PASS
BenchmarkFn-8	 2000000	       639 ns/op
ok  	local/typo	1.944s
Compare your results:
you can compare the benchmarks with benchcmp:
$ go get golang.org/x/tools/cmd/benchcmp
$ benchcmp mem.0 mem.1
benchmark         old ns/op     new ns/op     delta
BenchmarkFn-8     686           674           -1.75%

$ benchcmp cpu.0 cpu.1
benchmark         old ns/op     new ns/op     delta
BenchmarkFn-8     672           691           +2.83%
I don't think these results are significant. So let's try something else.
Comparing the compiled assembly code:
Let's compare the assembly codes of fn. You can do this by doing disasm fn inside pprof.
Before:
(pprof) disasm fn
Total: 512.19kB
ROUTINE ======================== local/typo.fn
         0          0 (flat, cum)     0% of Total
         .          .      7daf0: GS MOVQ GS:0x8a0, CX
         .          .      7daf9: LEAQ -0x20(SP), AX
         .          .      7dafe: CMPQ 0x10(CX), AX
         .          .      7db02: JBE 0x7dc55
         .          .      7db08: SUBQ $0xa0, SP
         .          .      7db0f: XORL BX, BX
         .          .      7db11: MOVQ BX, 0xa8(SP)
         .          .      7db19: MOVQ BX, 0xb0(SP)
         .          .      7db21: XORL BX, BX
         .          .      7db23: XORL DX, DX
After:
(pprof) disasm fn
Total: 512.19kB
ROUTINE ======================== local/typo.fn
         0          0 (flat, cum)     0% of Total
         .          .      7daf0: GS MOVQ GS:0x8a0, CX
         .          .      7daf9: LEAQ -0x20(SP), AX
         .          .      7dafe: CMPQ 0x10(CX), AX
         .          .      7db02: JBE 0x7dc55
         .          .      7db08: SUBQ $0xa0, SP
         .          .      7db0f: XORL BX, BX
         .          .      7db11: MOVQ BX, 0xa8(SP)
         .          .      7db19: MOVQ BX, 0xb0(SP)
         .          .      7db21: XORL BX, BX
         .          .      7db23: XORL DX, DX
If you compare the two assembly codes of these functions you will find that they are identical. So it is true! That answers my question, defining types inside functions will not impact the performance in any way.
Another method:
Another way to get to the same result (credit to Alan Donovan who told me about this) is to run the following command twice one with the type defined inside the function and one outside.
$ go tool compile -S typo.go | sed -e 's/\.go:[0-9]*//' -e '/^"".init/q' >in.asm
$ go tool compile -S typo.go | sed -e 's/\.go:[0-9]*//' -e '/^"".init/q' >out.asm
The sed script throws away line number information and truncates the disassembly at the start of the init.
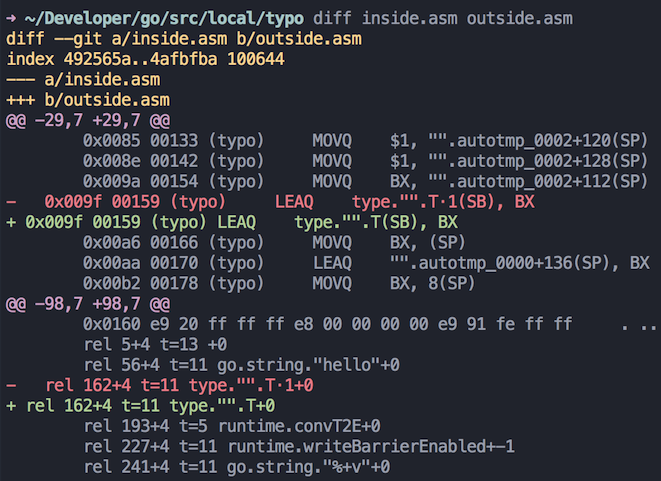
You can then perform a diff between the two files.
$ diff in.asm out.asm
@@ -29,7 +29,7 @@
        0x0085 00133 (typo)     MOVQ    $1, "".autotmp_0002+120(SP)
        0x008e 00142 (typo)     MOVQ    $1, "".autotmp_0002+128(SP)
        0x009a 00154 (typo)     MOVQ    BX, "".autotmp_0002+112(SP)
-   0x009f 00159 (typo)     LEAQ    type."".T·1(SB), BX
+   0x009f 00159 (typo)     LEAQ    type."".T(SB), BX
        0x00a6 00166 (typo)     MOVQ    BX, (SP)
        0x00aa 00170 (typo)     LEAQ    "".autotmp_0000+136(SP), BX
        0x00b2 00178 (typo)     MOVQ    BX, 8(SP)
@@ -98,7 +98,7 @@
        0x0160 e9 20 ff ff ff e8 00 00 00 00 e9 91 fe ff ff     . .............
        rel 5+4 t=13 +0
        rel 56+4 t=11 go.string."hello"+0
-   rel 162+4 t=11 type."".T·1+0
+   rel 162+4 t=11 type."".T+0
        rel 193+4 t=5 runtime.convT2E+0
        rel 227+4 t=11 runtime.writeBarrierEnabled+-1
        rel 241+4 t=11 go.string."%+v"+0
The only difference between the two files is the type names, which are T.1 and T.
I hope these methods and go tools can help you answer your own questions.Go check bradfitz talk on Profiling & Optimizing in Go if you haven't already.
Follow me at @santiago_arias to be notified about more posts like this.
Santiaago